Start here
Dashboard tour
Read workspace health, agent performance, usage, and recent execution at a glance.
Workspace health
The dashboard is the operating summary, not a configuration screen. Its four cards show configured agents, telemetry volume, event success rate, and provider usage across the current workspace.
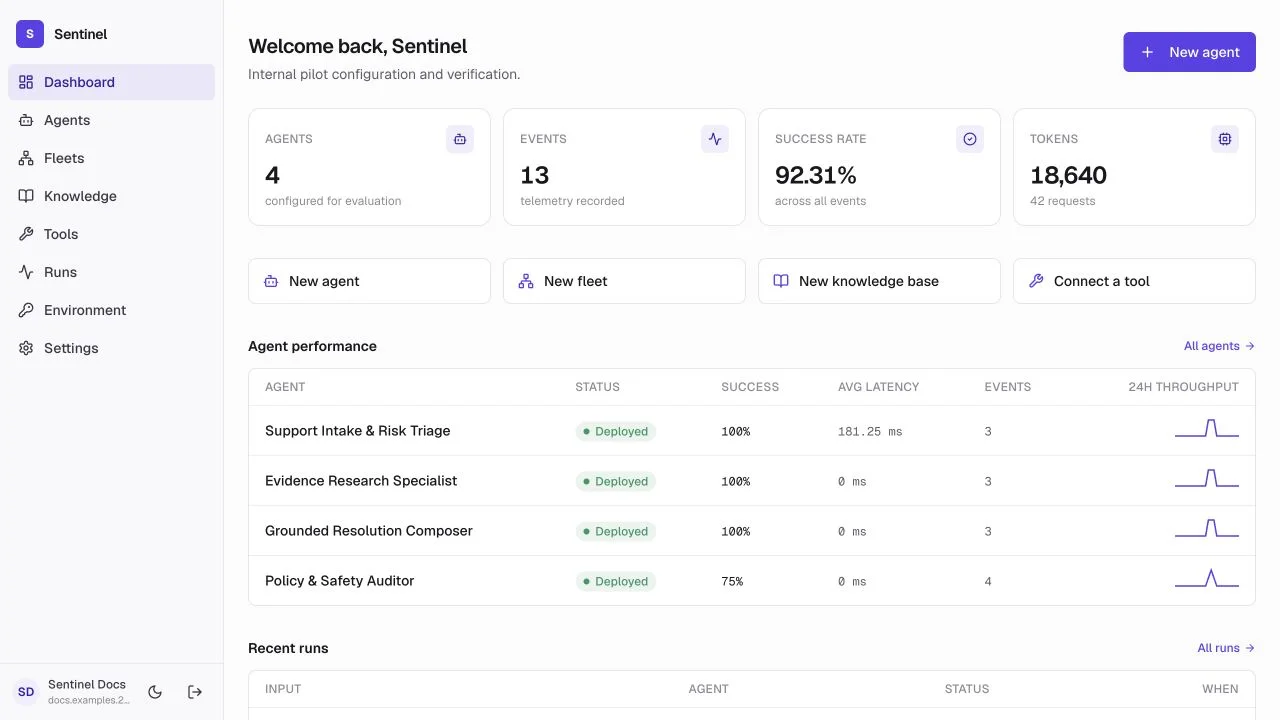
- 1Health cardsAgent count, telemetry events, success rate, and tokens or estimated spend.
- 2Quick actionsCreate the next agent, fleet, knowledge base, or tool without searching the sidebar.
- 3Agent performanceCompare status, success, latency, event volume, and 24-hour throughput by agent.
- 4Recent runsJump directly from a recent input to its complete trace.
Quick actions
These links are shortcuts only; they do not create resources until the destination form is completed.
Agent performance
- Status reports the saved agent lifecycle state.
- Success is based on recorded telemetry events, not subjective answer quality.
- Average latency is calculated from recorded run steps.
- The 24-hour sparkline shows event distribution, useful for spotting bursts or inactivity.
Recent runs
Use the input as the entry point. The run detail then shows the exact model, source, timing, input, output, and trace that produced the result.